- Kicking off OSMC 2024
- E2E testing with Selenium, Cypress and Playwright
- Grafana's paranoid observability
- Fluent Bit and enabling ChatOps
- Naemon meets Prometheus
- Telegraf: InfluxData's telemetry collector
- Statistics lie!
- Icinga becoming more accessible for DevOps software
- SofaScore and their (cost-effective) way to 25 million users
- It was nice, thanks!
After six long years I've finally made it back to the Open Source Monitoring Conference (OSMC) held in Nuremberg, Germany. The talks and presentation – and also the expectations of the audience – have clearly shifted from classic "systems monitoring" to a metrics based monitoring.
Buzz keywords in general have been Telemetry, Metrics, Traces and definitely Grafana. Almost every presentation mentioned Grafana among other things. But the "classic monitoring" was also still present with the folks from Consol having added a Prometheus+Grafana replacement for PNP4Nagios in their Naemon based monitoring and even Icinga added new fancy features, which could turn out very useful for newer Devops oriented infrastructures.
Kicking off OSMC 2024
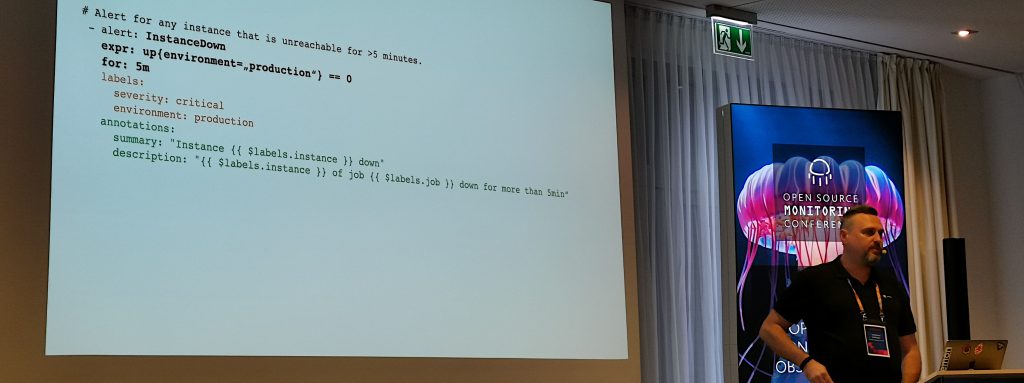
As always, Bernd Erk from Netways kicked off the OSMC with an introduction speech. And as every year, some presentation bug kicks in as well *wink wink*. The beamer became flaky, becoming more of a disco light than a slide presenter. But as always, Bernd shaked it off like a pro and carried on. Roughly one third of the crowd was visiting the OSMC the first time.
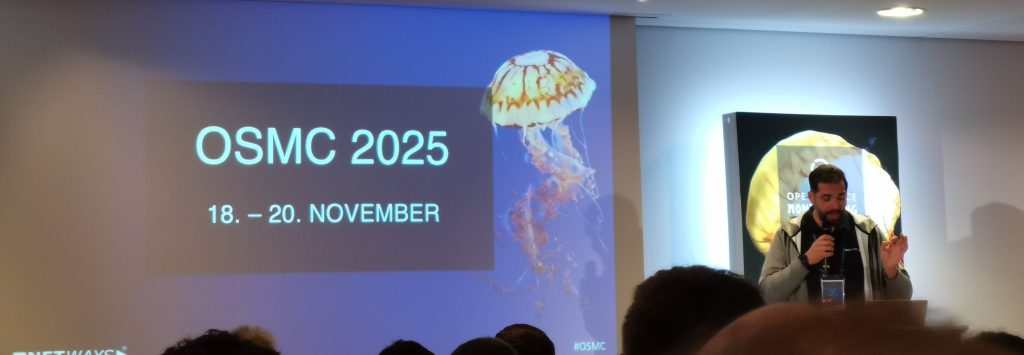
During this introduction the dates for OSMC 2025 were already presented: The OSMC 2025 will take place in Nuremberg on November 18th – 20th 2025.
E2E testing with Selenium, Cypress and Playwright
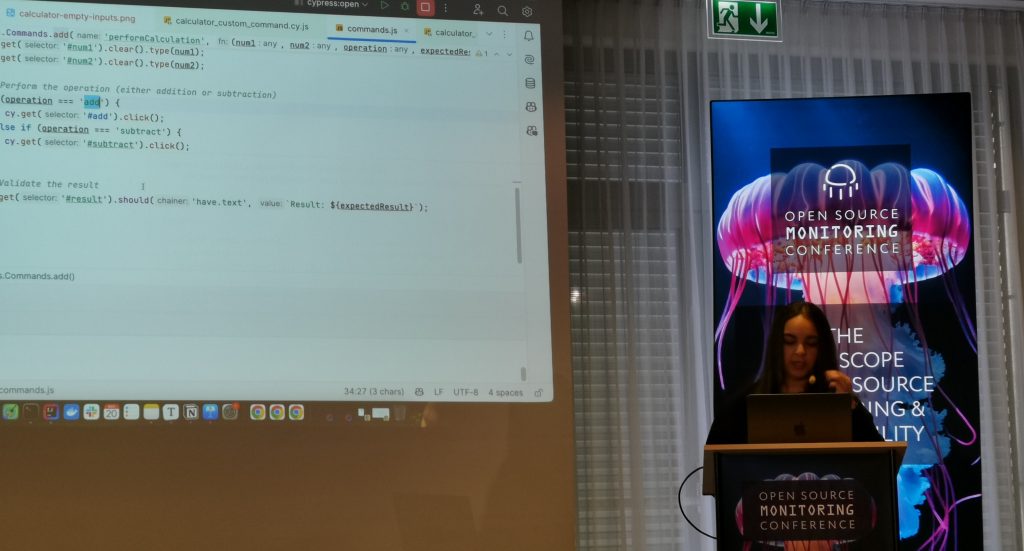
A very interesting talk was given by Soumaya Erradi. She presented three different ways of creating Quality Assurance / User Experience (UX) testing, also called End to End Testing (E2E). She compared Selenium, Cypress and Playwright. Three open source tools used for automated user experience testing and therefore simulating actual users using a browser on a web application.
Her comparison of the three tools helped attendees to understand key differences and benefits but also the cons of each tool.
——————————
Selenium
Selenium, available since 2004, has a large user base and community and supports multiple browsers (Chrome and Firefox). It supports multiple languages, including JavaScript, PHP, Python and others. That means you can write your tests in your favourite programming language. However the tests can sometimes be slow and flaky and the base setup is rather complex.
Cypress
Cypress exists since 2014 and focuses on JavaScript – but also supports JavaScript written tests only. It has a nice user interface and allows to see each step of a test historically; a great helper to know exactly at what time the test failed and what the user saw at this moment in time. As the tool is plugin oriented, additional plugins may be needed for certain tests. Unfortunately only Chrome is supported as browser engine.
PlayWright
Playwright was released in 2019 and is therefore the youngest project of the three. The community and documentation are therefore not as big and well done as the others, but the user-base is quickly growing and Playwright will eventually catch up their caveats. Originated from developers working at Google, Playwright is now a Microsoft labelled tool, but remains open source.
As Selenium, it supports tests written in multiple languages, such as Python, JS or Java (but no PHP here). The "headless" mode is a very nice way to run non-interactive tests. Another great feature is the support for mobile emulation, allowing a E2E test with a simulated phone. On the negative side the API is rather complex and the programming syntax is not as intuitive as the others. Playwright supports all current browsers including Chrome, Firefox, Safari and Edge.
——————————
After having seen a demo test on all three tools, every attendee was able to judge for him/herself which tool would best fit in an environment. Thanks to the great presentation and the technical comparison, I'm sure many listeners in the room just saved a lot of time trying to figure these points out themselves.
Grafana's paranoid observability
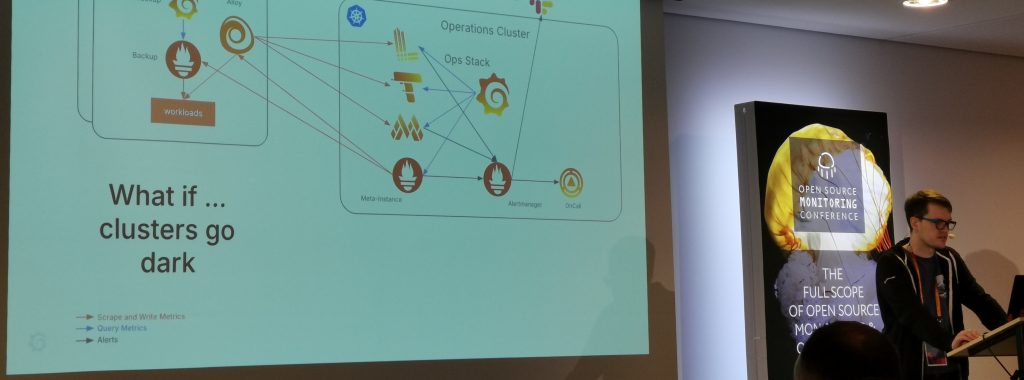
Some companies use some monitoring and observability tools, others use nothing and (kind of) live with it, and then there's Grafana Labs. They've asked themselves questions over questions and even more questions. What if a cluster goes down? How can we monitor a cluster? But then how can we observe all clusters worldwide in a global view? Yet how can we reduce our Prometheus write operations?
Many questions, many answers, several attempts but after all a great and interesting story telling from Erik Sommer. The most interesting fact was the "Meta" Prometheus instance, which Grafana labs uses, to scrape data from all other Prometheus instance and serve as the "global view" instance.
Bigger infrastructure, bigger problems
They eventually ran into a big issue with that setup as they over-queried Prometheus with over 175 Million queries per second. In order to fix this – but more resources was not possible. Not even the biggest available instances from cloud providers would have been able to cover that. Finally they (regex-) optimized the local Prometheus clusters and therefore reduce the number of total queries on the Meta instance.
Their sophisticated all-around-the-world and fault-tolerence setup of observing Grafana Lab's infrastructure sounds bullet-proof. But what if this system goes down anyway? For this purpose they introduced a "Dead Man's Snitch". This is basically a service waiting for an automated notification call from Grafana's observability alert chain. If after 15 minutes no request is received on this service, the Dead Man's Snitch triggers calls to on-call engineers. According to Erik this has happened three times so far. The reason for two events was a false positive – the one alert which was actually really a production issue was due to a deployment which broke the alerting part (but observability of metrics with dashboards still worked).
Fluent Bit and enabling ChatOps
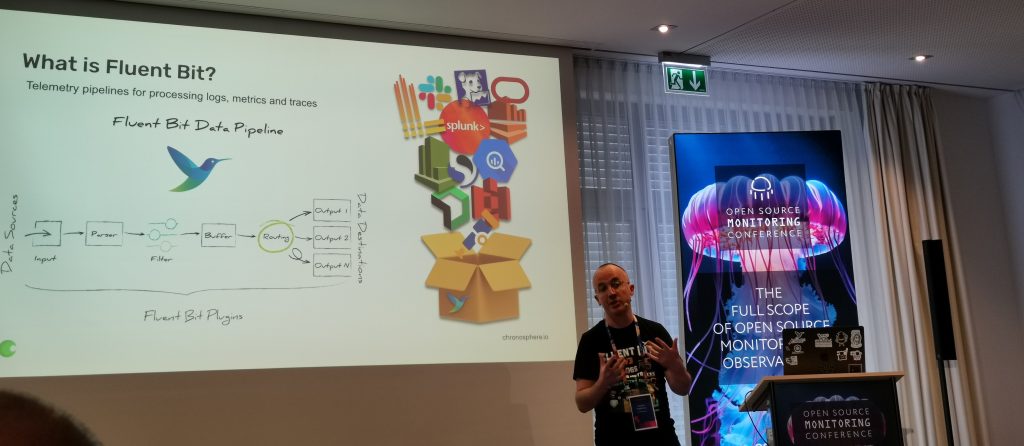
Next up was Patrick Stephen's presentation and introduction of Fluent Bit and how this integrates into ChatOps. I was glad I attended this presentation because finally, after years of having heard of Fluent Bit, someone could in a few sentences explain what it actually is and does.
What is fluentbit?
So basically Fluent Bit provides inputs for different types of data, does data processing (whatever you tell it to do with filters or code) and outputs the processed data to an output. Yes, this is very similar to the OpenTelemetry Collector (as someone asked at the end of the presentation), but there can be very specific (legacy) systems or applications which might never become part of the OTel Collector inputs or outputs so Fluent Bit got the better coverage (for now). But as Pat suggested, at the end it comes down to personal preference, which is a very true statement.
ChatOps?
Patrick showed an interesting demo of a ChatOps integration. First of all, what ChatOps actually is. As he described his day as maintainer of Fluent Bit: Discussing a lot in Slack, doing some work in between and being on Slack again. It makes total sense as all roles and levels in an IT company are involved in some kind of communication channel, whether this is Teams, Slack or something else. And a lot of time is spent there; ChatOps.
ChatOps integration example
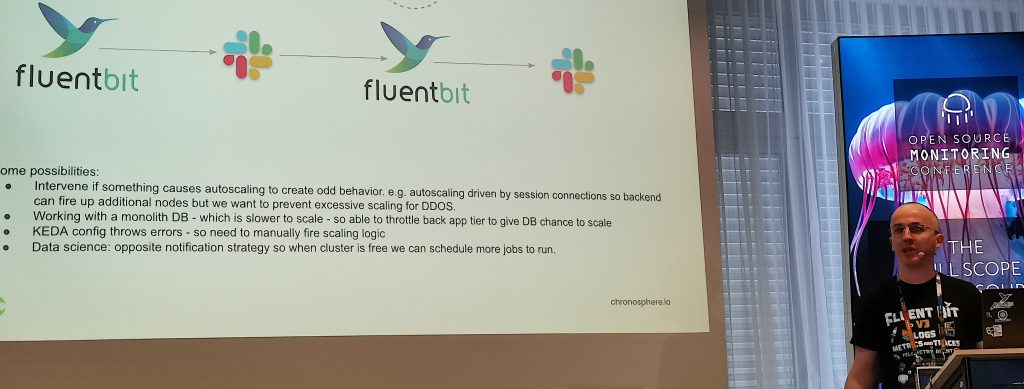
His example of an integration into ChatOps showed an alert picked up by FluentBit and sent via an output to a Slack channel. So far so good, the team in Slack can see the alert. But he went one step further and sent a reply in the Slack channel, which was picked up by FluentBit and executed the command mentioned in the chat. The goal behind such an idea could be a very quick way of problem solving, without having to actually log in to a VPN or system or even start your computer. Of course there are security concerns with this approach, as Patrick rightfully pointed out: Don't do this in production! But the demo did it's job: It showed a practical example of such a ChatOps integration.
Naemon meets Prometheus
But not all presentations were about DevOps tools, metrics and traces. The talk of Matthias Gallinger focused on Naemon, a fork of the "original monitoring tool" Nagios. Nagios and Naemon have been around for a very long time. It was not surprising that some younger attendees did not know the concept of a "monitoring core" and "plugin execution", let alone the 4 exit codes and colours these monitoring tools work with.
Nevertheless Matthias showed how that all works – and what doesn't. He mentioned the legacy way of creating historical graphs from performance data using RRD (a file based metric database with a limited history). Due to the aggregation of data within these RRD files, data from a specific day or hour is lost and aggregated over time into one value.
This is why they found a way to run Prometheus alongside Naemon and integrate the Grafana visualization into Thruk (a User Interface for Naemon and other Nagios-based monitoring cores). The unofficial reason for this change: "It's cool sh*t!". True that!
Prometheus and long-term storage
A very interesting point he mentioned was their lesson's learned from starting with Prometheus: Prometheus is not built for long-term storage. In order to cope with this they have evaluated and are now using Victoria Metrics. This is a backend for Prometheus, built for being a long term storage for the metrics. It is InfluxDB compatible, easing a potential migration from an existing InfluxDB or at least for creating Grafana dashboards built on InfluxDB data sources. The query language is MetricQL which is similar to PromQL.
At the end Matthias also presented a (personal) view on the monitoring trend: The future will clearly be dominated by metrics-based monitoring. But at the end companies need to decide whether to run observability and metrics-based monitoring tools along side classic monitoring software (monitoring cores) or to replace these completely.
Telegraf: InfluxData's telemetry collector
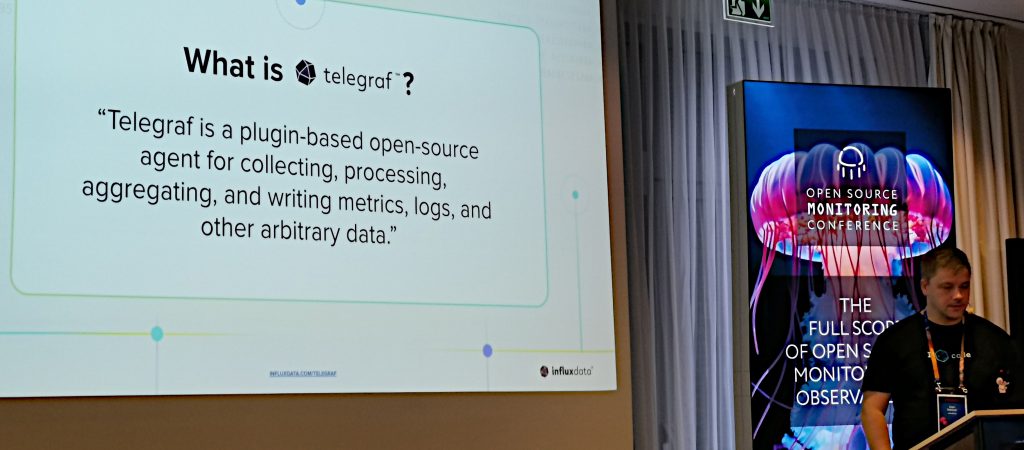
The following presentation switched back to metrics based observability. Sven Rebhan from InfluxData presented and and introduced Telegraf to the crowd.
Similar to the previous Fluent Bit, Telegraf offers more than 200 input plugins, does data processing and sends the processed data to an output plugin (more than 50) which in turn send the data to a so-called "data sink" backend. Thanks to the "Secret Store" plugin you can avoid passwords showing up in the data processing and helps you keep your credentials secret.
Sven showed a very nice demo with the Telegraf pulling internal cpu and memory metrics (from the localhost) and inserting the metrics into an InfluxDB running in a local container. The configuration he showed seemed very intuitive and straight-forward, without becoming very complex.
He went on and mentioned that Telegraf's internal buffer is able to keep metrics (from the Input) when the backend (Output) is defect. To proof this he paused the InfluxDB container and – obviously – Grafana showed no more live data coming in. As soon as he unpaused the container, the metrics showed up in the dashboard again; with the correct timestamps. As if there never was a pause in writing the data into the time series database.
Statistics lie!
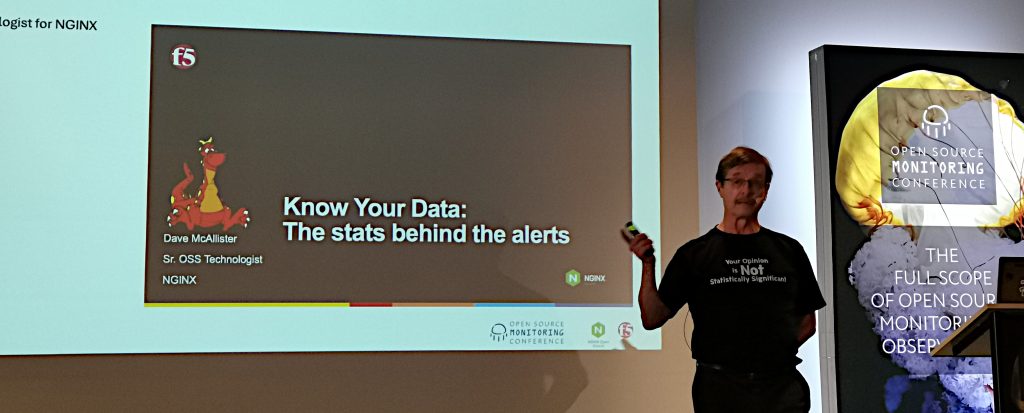
A very refreshing presentation came from Dave McAllister from F5 (NGINX): The Subtle Art of Lying with Statistics. Or, as Dave said it loud and clear, STATISTICS LIE! ALL THE TIME!
The first highlight of this presentation already started minutes before the presentation would actually start. The sound check of the speaker with the audio technician. While the technician awaited a typical "1,2,3 – 1,2,3" (or something the like), Dave quoted a poem he'd memorized. While he spoke, the chatty room (the session break still ongoing) became silent and everyone started listening. When Dave finished the poem after around 1-2 minutes, the people already in the room promptly applauded. That was definitely not expected. And the audio technician stood there, stunned.
Statistics are misrepresented or based on biased data
This presentation did not focus on anything technical. No open source tool, no metrics and no hands-on IT software involved. And that was the exact reason why this presentation came in the perfect moment: It allowed the attendees to breathe through and relax their minds a bit (without the need of finding a use-case for a tool or software in their own environments). The presentation was funny – but the message of Dave was also dead serious: Statistics are way too often misrepresented and therefore misunderstood.
He showed a couple of real-life examples of statistics not actually representing all data and informed about different types of graphical manipulation or data collection biases. And the fact that "people would believe anything if you put numbers in it". And cute pictures always help to influence an opinion, too.
Higher beer consumption leads to more marriages
A very good example was a graph showing two lines: Number of marriages and number of consumed beer in the United States. While the X axis (as usual) represents the time-line, the Y axis represents the numbers. Both lines followed each other and were really close over the whole statistic. So does that mean the number of marriages increased because the beer consumption went up? Or does it mean the beer consumption went up because there were more marriages? WRONG! The missing piece is that these numbers were based on the number of people living in the United States. Obviously the more people, the higher the total beer consumption and also the more marriages. This statistic is a misrepresentation of the actual data – however totally valid and correct. But without that missing information (a third line of population growth), that statistical graph is totally misread.
Icinga becoming more accessible for DevOps software
Bernd Erk took the stage, once more, and presented the current state of Icinga2. Although there were only minor changes in the recent releases, the first focus of the talk was on the recently discovered security vulnerability (CVE-2024-49369). The vulnerability existed for such a long time, since Icinga2 2.4.0, that you really need to go several years back to understand how long this was undetected. A detailed explanation is going to be released later this month (November 2024) – after everyone has had the chance to patch the vulnerability.
Although there is no fixed schedule for the 2.15 release yet, the new version should contain improvements for large environments (we're talking thousands of agents and servers).
Besides talking about the roadmap and versions, Bernd also showed two Icingaweb2 modules I personally did not know yet and looked very promising.
Kubernetes Module for Icingaweb2
The Kubernetes module (currently in development) is able to obtain all kinds of data and state information from a Kubernetes cluster. This is helpful for an automated import of a K8s cluster into the Icinga2 monitoring. But not only helps this to monitor the state of deployments or pods, it helps to find the correlation between them.
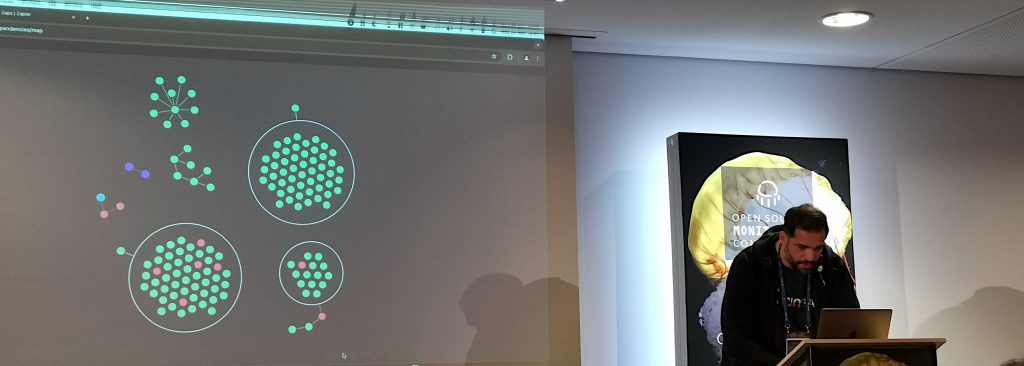
In the live demo (which worked this time!), Bernd showed that the UI allows to follow the "tracks" of a deployment. Meaning the correlating ReplicaSet of a Deployment is automatically showing up. A click on it shows the state of this ReplicaSet – and again shows the correlating pod(s) associated with this ReplicaSet. This helps to quickly find which workloads, deployments, services, pods etc belong to each other. That's something which is not that easy with metrics alone.
Notifications module
Notifications have always been something you needed to configure inside the Icinga2 core and implement some scripts sending out the actual notification. If you wanted to send notifications to a webhook (e.g. Slack) you needed to create new scripts and create Notification objects. And assign users (contacts) or user groups (contactgroups) to these notifications. And assign services or hosts to these… You get the point – it's not obvious and can quickly become complex.
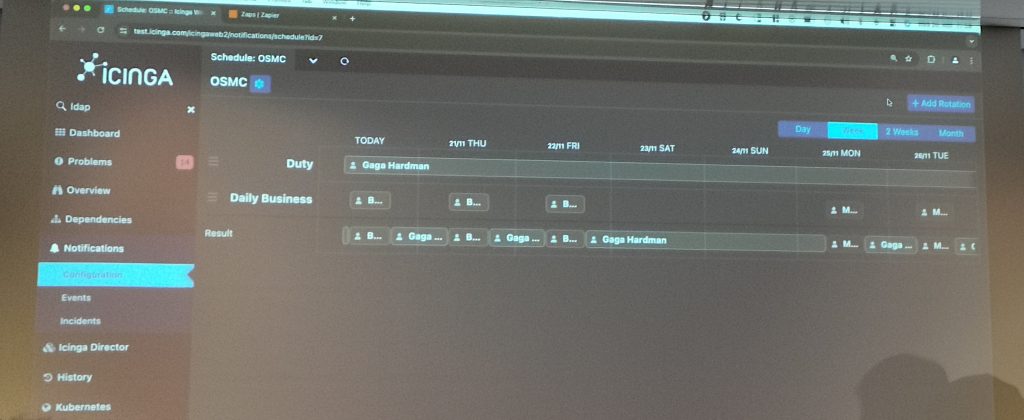
The notifications module is going to change this. It's a UI driven creator of notifications that supports everything needed in a modern alerting configuration. You can create multiple schedules. For example covering 24×7 or just a night shift. Rolling over night to day shift, assigning different contacts/groups to each shift and also prioritize who should get an alert first.
One of the greatest features of this module is the "Channel" configuration, allowing to separate multiple ways of how a notification should be sent. This can be a classical e-mail notification or can be a webhook to a service. Bernd showed an example where he used a Zapier webhook to handle notifications from Icinga. As this is all part of the notification module, no additional scripts need to be created and maintained. Nice, this is really a great enhancement!
One central tool for alerts (notifications)
The goal of the notification module is to replace the current "in-core" notification configuration, therefore moving away from the configs to this "Notification management" module. But thanks to this module, other tools (e.g. Grafana Alertmanager or Prometheus) are also able to send their alerts to this module. According to the rules and schedules, these alerts are then sent out via the defined notification channels. This allows Icinga to be the central monitoring and alerting tool in an infrastructure, running alongside modern metrics-collecting observability tools.
SofaScore and their (cost-effective) way to 25 million users
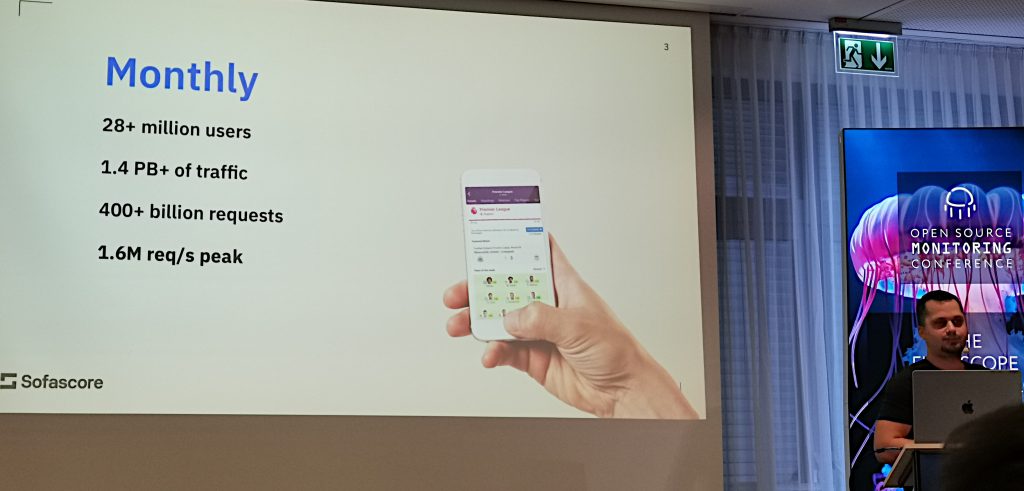
A very cool presentation came from Josip Stuhli, the CTO of SofaScore. Honestly I haven't heard of SofaScore prior to that presentation, but I was immediately impressed. SofaScore is a widely used (25 Million users!) application to get real time scores of sport games.
Josip kicked the presentation off with how they started the company. At the beginning they started with one single server running the PHP application. But they quickly realized that the traffic would peak during a game. The traffic would increase 4x in the 15 minutes prior to a popular game. Too many requests, server becomes slow and runs in time outs. I guess we've all been there and can relate.
El Clasico
Josip also mentioned a (technically speaking) really funny approach when the famous teams FC Barcelona would play against Real Madrid. This game is also called "El Clasico" and is known by every football fanatic. In order to cope with the highest traffic of the year and fix it in 15 minutes, Sofascore just set up a static HTML page and updated the page manually whenever a goal happened. I loved the smirk on Josip's face when he described this method as "pretty dumb, but it worked!". Of course this was in the early years of Sofascore and they're infrastructure doesn't look anything like this anymore.
We need cache and scaling!
So Sofascore decided to add some caching. They added Memcached to cache the results, which helped. But with increasing number of users and traffic, they ran into a new problem: The cache stampede problem. Once the content could not be delivered from Memcached (cache expiry or a technical problem), the backend server would be hit with the full burst of requests. Taking the backend down, again.
The user numbers grew and so did the pressure on the server. Josip knew they needed to scale – especially during the peaks and important games. And where can you scale quickly? In the cloud. So SofaScore went to AWS and started to run their EC2 instances, able to scale up quickly if needed.
Once they realized how good the backend works with Caching, they decided to cache everything and replaced Memcached with Varnish. Now SofaScore puts everything into the cache, even personalized content. "It's trickier, but doable" as Josip commented on it. I fully agree, with the right hashes, proper vcl configuration and a cache TTL that makes sense, you can definitely achieve this
Databases
They also decided to use MongoDB as their backend database. However they quickly had to realize this was the wrong desicion as they ran into serious issues (broken replication and data locking among others). That was an important lesson learned shared by Josip: "If it doesn't fit your application, stop using it".
Eventually PostgreSQL was introduced as backend database. And with SofaScore's 1 million queries per second the performance is still great. However there's always something to optimize. If some query takes up 50ms and this query is called 1 million times a day, it's a lot of time. Josip showed PGHero as their tool to have a look at time consuming queries and try to optimize these.
All the PostgreSQL queries are logged into an ELK stack for further observation and debugging purposes. By the way, they never used AWS RDS for their database, they always ran their own PostgreSQL instances on EC2.
The cloud is expensive!
And then came a very interesting part of the presentation! Now with a continuous growth of users and more and more traffic, SofaScore's AWS bill would become larger and larger. They realized that it's not even the computing power of their EC2 instances, but rather the egress (outgoing) traffic. Josip and his colleagues also realized that the backend is not that heavily used as long as the caching is working correctly.
So they came up with an idea to save the enormous egress costs from AWS: Let's move the caching layer back to on-premise and just keep the backend in AWS. They built a stack of multiple Varnish Cache servers, added some load balancing and voilà: The AWS bill sacked down immediately. Yet everything was still performant and fast for the end users.
Which led to the next idea: What if we move everything out of AWS? And that's what they did. They basically ordered machines with the double amount of capacity they were currently using in AWS, moved everything on these machines and – everything still works! For the fraction of the previous costs. Basically with the doubled performance capacity available on-premise the new bill was 1/5th of the previous AWS bill.
CDNs
Meanwhile most Varnish instances in the setup have been replaced by Fastly as global caching CDN. But they also work with Cloudflare. And here Josip also had a funny annectode to tell. Once during a big game a lot of SofaScore users went on the app and clicked on something – causing an immediate peak in traffic. Cloudflare's own DDOS detection declared this as a DDOS attack and blocked all the users from SofaScore. Josip went to speak to the Cloudflare engineers to fix this. And Cloudflare did. In the most ingenious way ever: If customer == sofascore, then don't run this Anti-DDOS rule. Josip believes this line is probably still somewhere in Cloudflare's DDOS rules.
The talk from Josip was great and showed the struggles and technical problems of a fast growing startup and how they fixed all this. From 0 to 25 Million. Well done!
It was nice, thanks!
What else is there to say than thank you for the nicely organized conference. Not only to the OSMC crew, but also to all attendees as these folks are easy going and down to earth. Some very interesting topics were discussed in the hallways, in the breaks and of course during the meals and the evening event.
Thanks also to everyone I personally talked to and got to meet. It was a pleasure!

